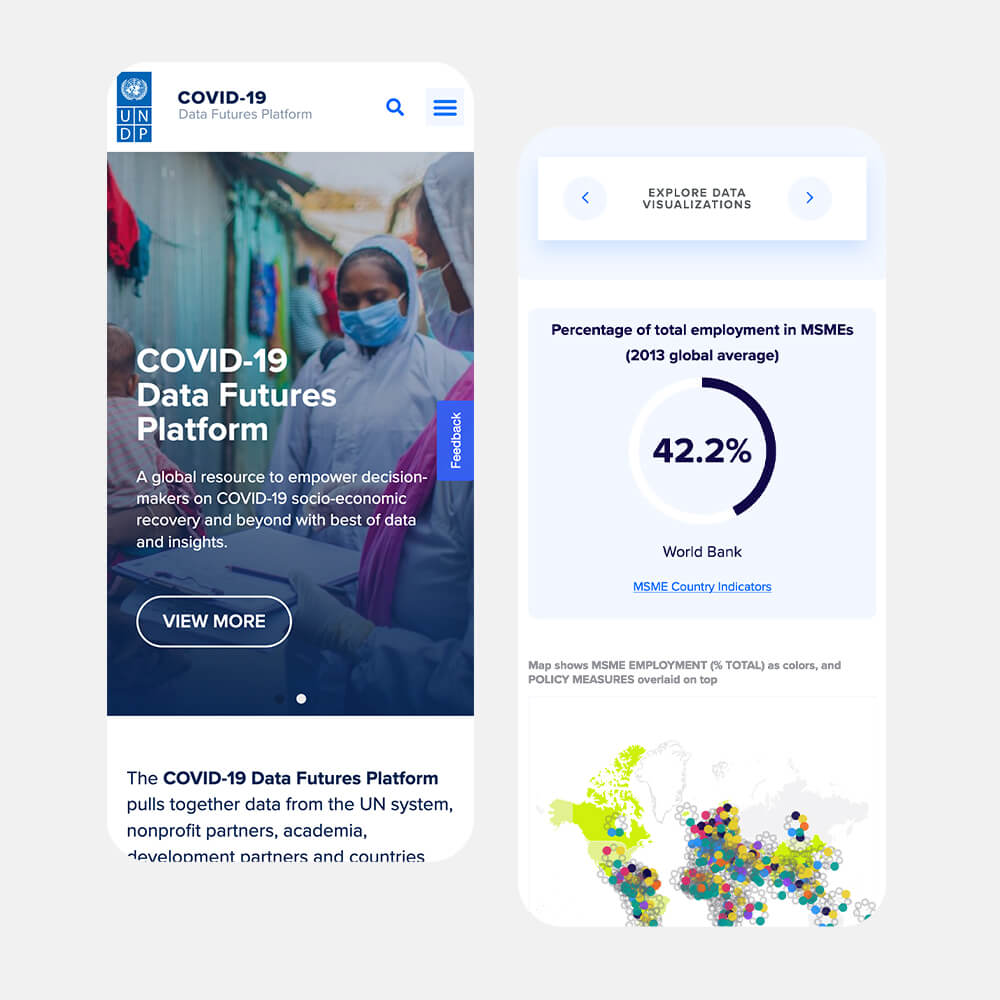
Approach & Direction
With the amount of data that was being collected and organized, this was a large team effort. We partnered with a company called Small Multiples which was in charge of integrating the data into Tableau.
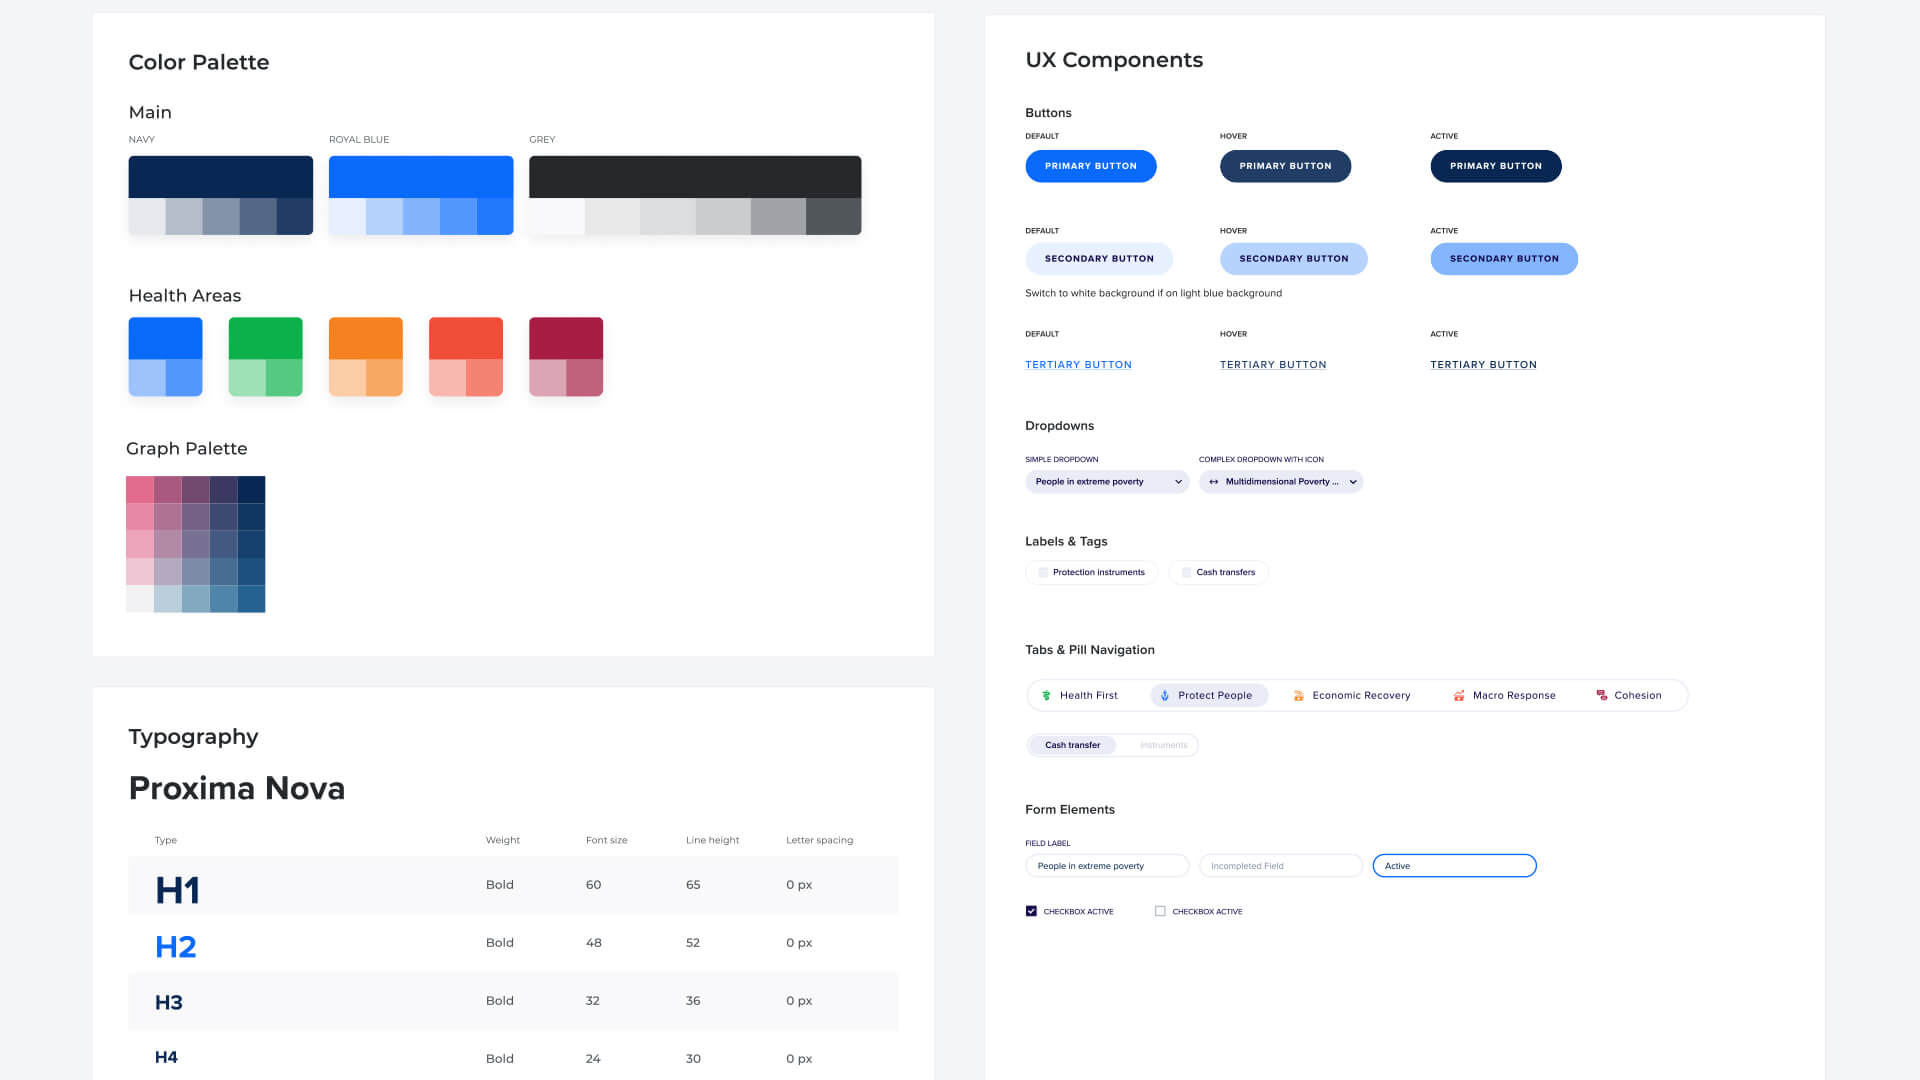
The design team got to work creating a design system with all the necessary elements that would be needed to create this cohesive environment.
I was tasked with finding the most efficient way to display all the needed information about each country and how it relates to UNDP’s pillars.
Design Review
The system that the design team came up with was a beautiful base to start developing this project. I collaborated with them to ensure we would have as many bases covered from a design perspective as we did not have the data to determine what would be required to build the site.
This design system was used by Small Multiples to match some of the Tableau content as well as myself to build the site around.
Execution
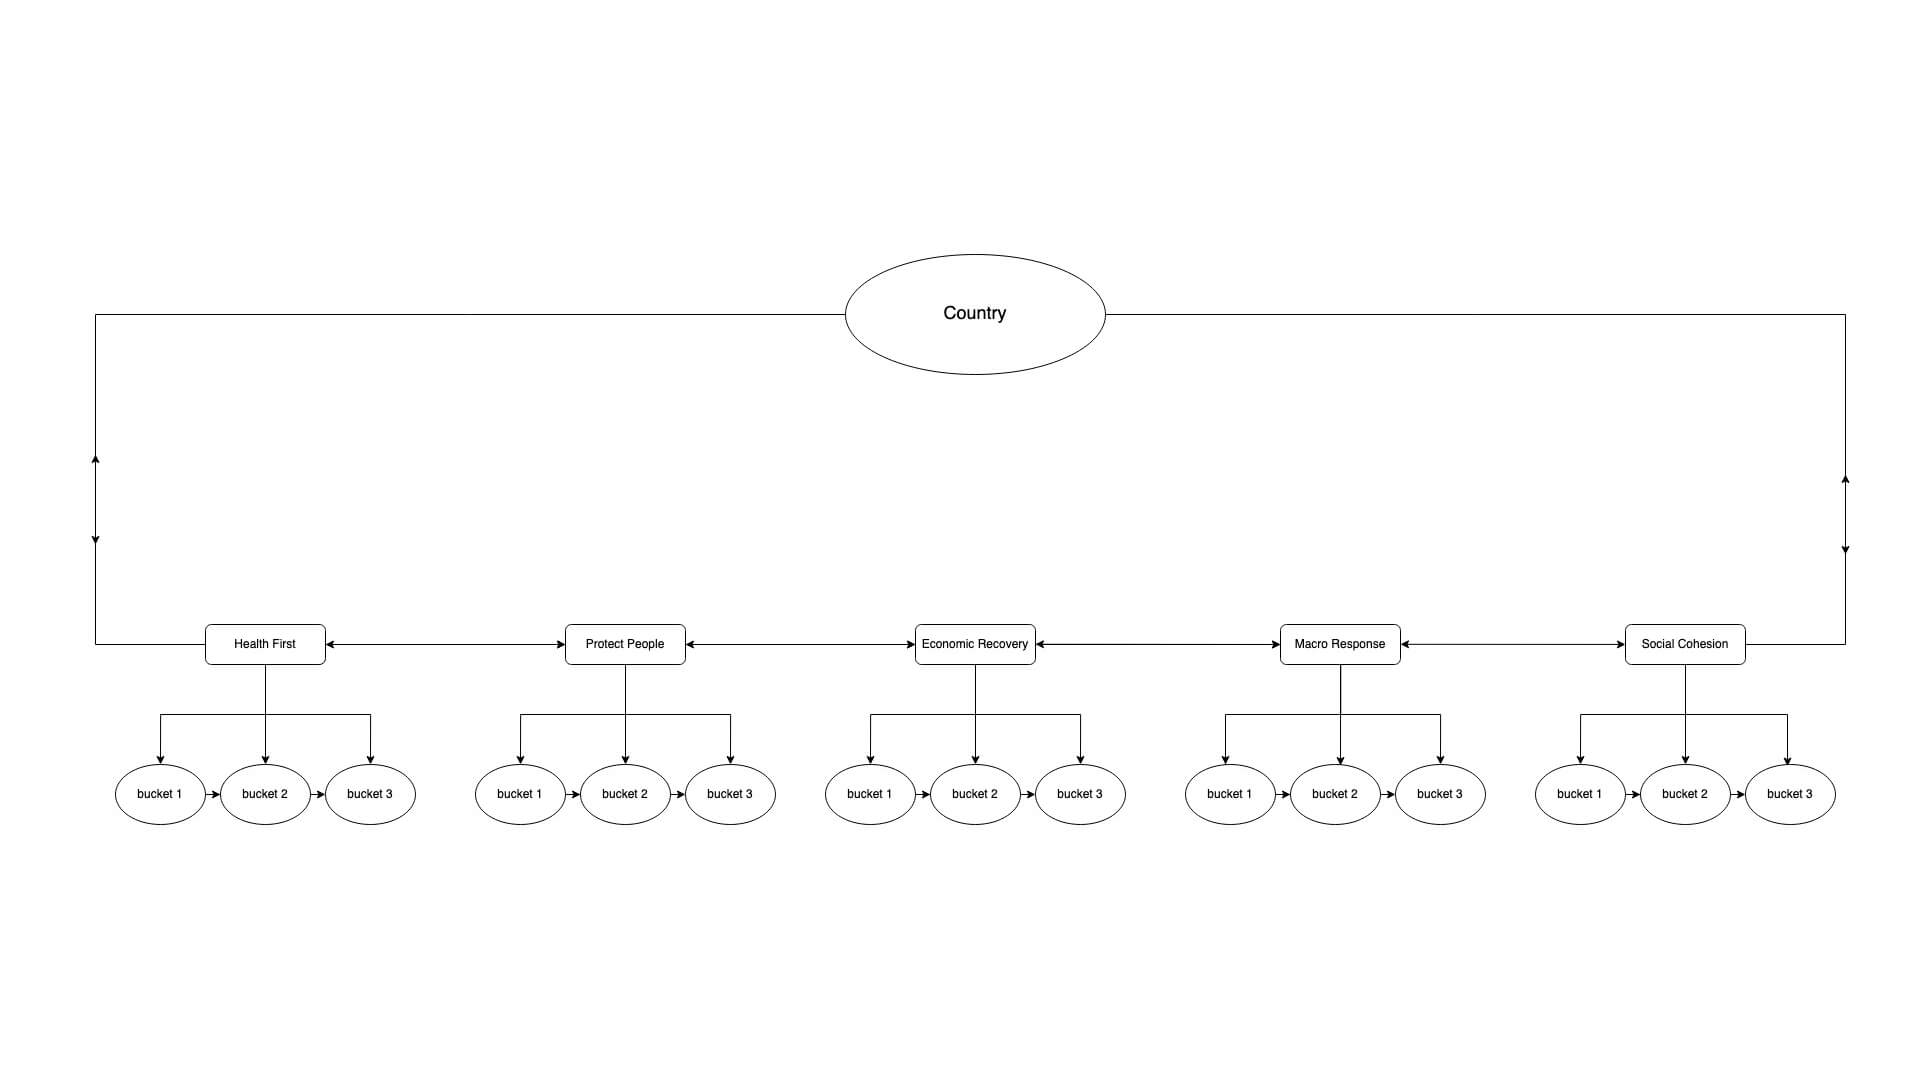
I needed to create a system that allowed each country to have its own page to display data relative to that country. However, UNDP needed the ability to allow the country to see the data through the lens of each of their five pillars of their framework of socio-economic response:
- Health First
- Protect People
- Economic Recovery
- Macro Response
- Social Cohesion
Most of these five pillars also included about three sub-pillars each which we called “buckets.” Each country needed to view its own data related to these five pillars and their three buckets.
Since most countries required all of these views I didn’t want to make 20 pages (5 pillars + (5 pillars x 3 buckets)) for each country. With efficiency in mind, I thought about creating the needed 20 pages and then viewing them through the eyes of a country. This could be done with a query parameter in the url.
I synced up with Small Multiples and they confirmed they could grab a url query and generate the requested Tableau data.
After a very large google spreadsheet collaboration we had the agreed upon URL slugs and query parameters for every country, pillar, and bucket.
Challenges
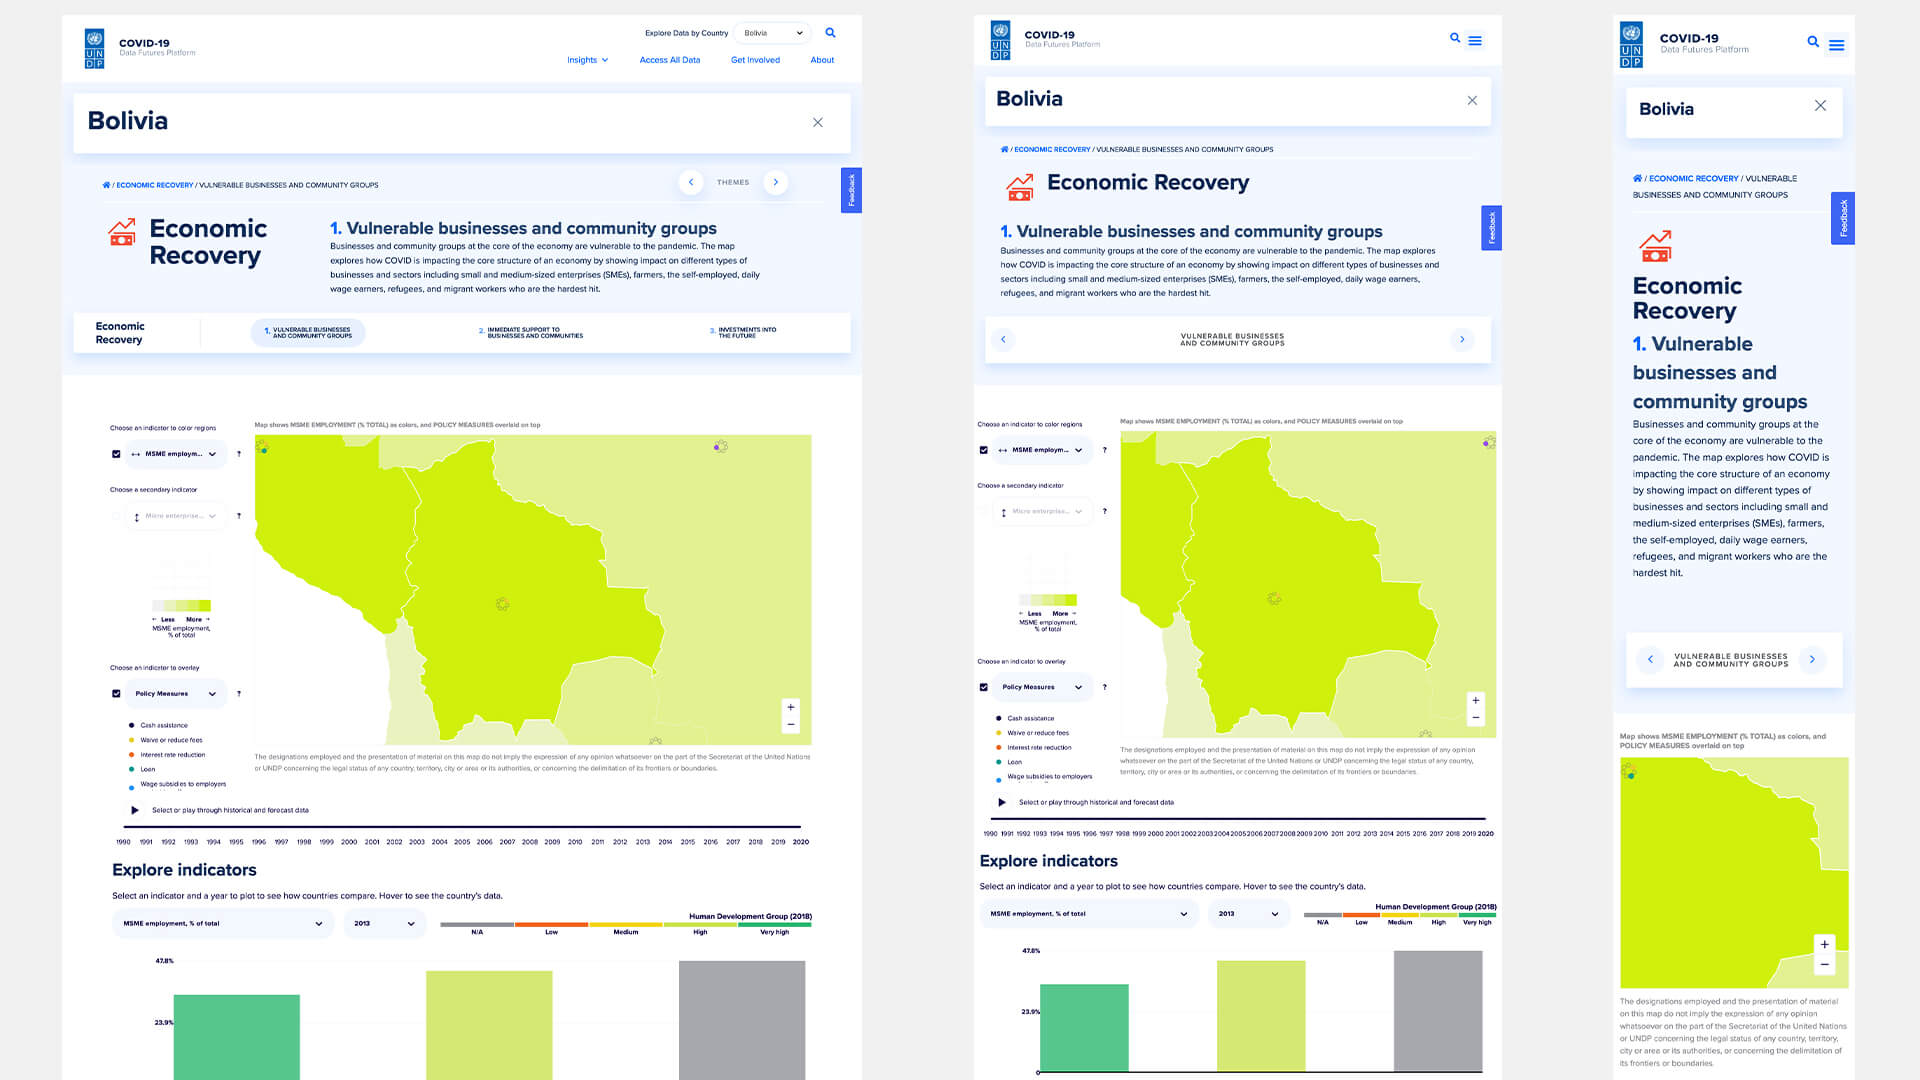
The request and response for data was solved. When on a page choosing a country to view, the data would place a url parameters prompting the embeds to reload with the information filtered for that selected country.
The challenge was when a user navigated the site. Do we keep the url parameter? How would the user know they are viewing data filtered by that country?
Solution
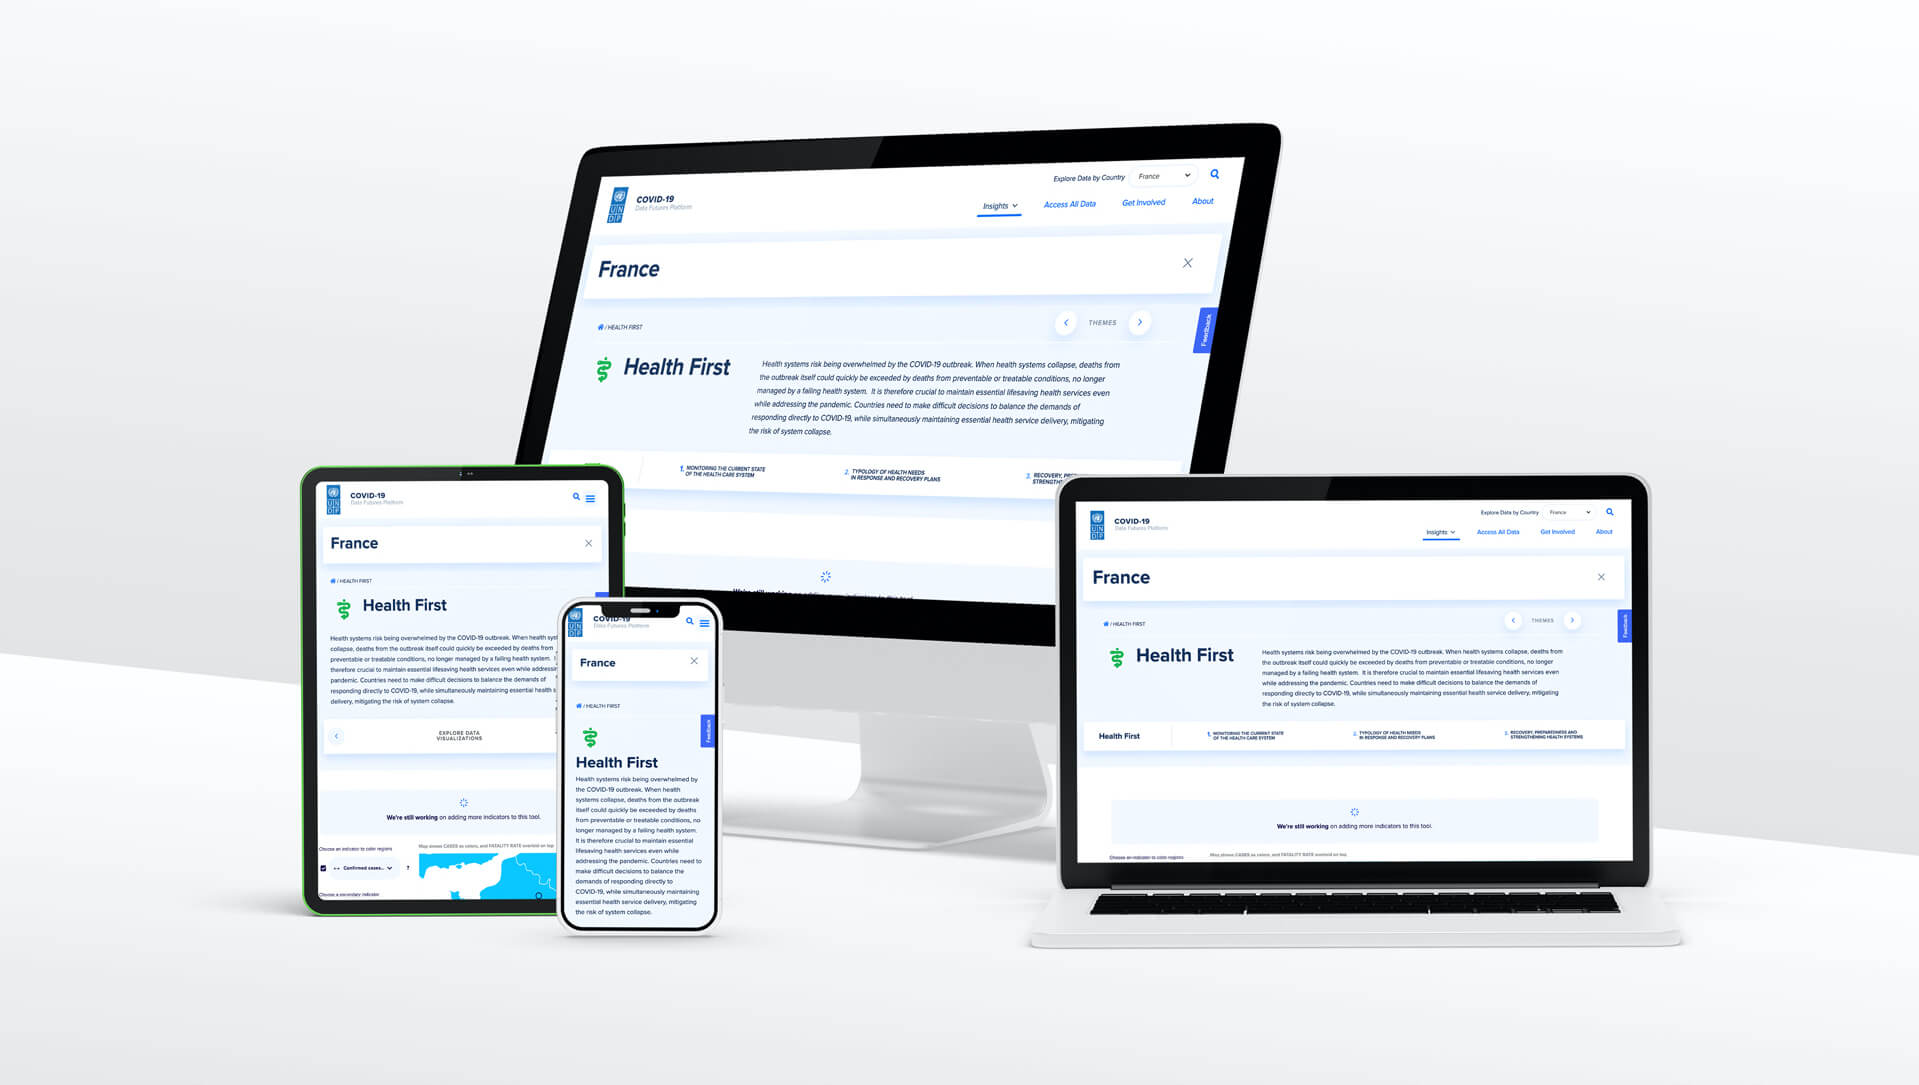
I partnered with Design and we collectively decided it was best to keep the country filter (if set) as the user navigated around the site. Design only had to create one new element for the top of each page to indicate if the user was viewing data through the filter of a country.
This was accomplished by adding a cookie once a country was set. This cookie would accomplish the following:
- Add country url parameter
- Change all dropdowns to that country
- Add new design element to the top of each page (indicating country view).
A user could then choose another country to view the data, or close the new design element for that country and be able view the regular data not specific to a country.
Conclusion
This was a challenging and rewarding project. Collaborating with a team in Australia to solve complex data problems, while only communicating virtually, proved to be challenging. In the end, it was efforts from our entire team and the collaboration and flexibility of all the teams that brought this project to launch.
